Unknown amount of graphs on a single page

Hi, I’m looking to add some graphs to a slide, however the amount of graphs might change so I’m not sure how to handle the location properties.
I have attached an image of what I’m trying to replicate.

This slide has has 4 graphs however it could be less or more (to overflow to the following page)

Only way I can think of doing this would be to add it to a table? then loop through the cells and add a graph to each, unless there’s a better way?

Hi Joseph,

I’m not exactly sure how the table will solve your problem, note that the table rows can also end up going beyond the slide’s area.
In other words, I presume that you want those rows that don’t fit on the current slide to automatically move onto the next slide (like they do in Word files), but that won’t happen.

So what you’ll need to do is keep track of the available area that you have on the current slide.
For example, something similar to this post where a table is being split into multiple slides:

Or this for splitting textbox:

I hope this helps.

Regards,
Mario

Ok great, the first link seems to be what I’m looking for. thank you.

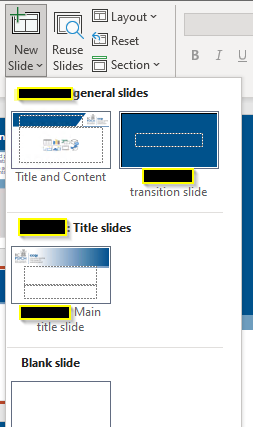
Off the back of this, when adding a new page how would I go about using an existing template?
I am able to add slides fine but I can’t seem to find any explanation on how to define a “custom” slide

slide = presentation.Slides.AddNew(GemBox.Presentation.SlideLayoutType.Custom);

In the ‘master’ template there are existing slides:
image

How would I go about inserting a copy of one of these?

Hi Joseph,

Use this:

var presentation = PresentationDocument.Load("input.pptx");

var layoutSlide = presentation.MasterSlides[0].LayoutSlides
    .First(ls => ls.Name == "Main title slide");

var slide = presentation.Slides.AddNew(layoutSlide);
// ...

Regards,
Mario

1 Like