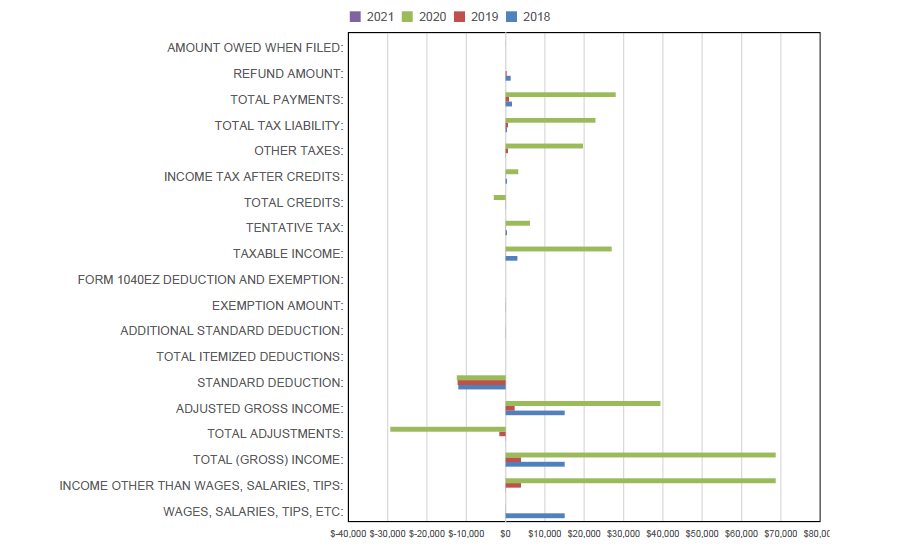
I have a chart that is losing some properties when printing to PDF and gaining other. As a new user I can only add one image. In the image below the horizontal axis labels are at 20 degrees and is set to $20,000 grid lines. When I print the spreadsheet to PDF, the text is horizontal, and it adds additional grid lines at $10,000.
Is there a way when printing the spreadsheet to print the chart(s) as images and maintain its settings? I am using the following print command:
workbook.Save(pdfFile, new PdfSaveOptions() { SelectionType = SelectionType.EntireFile });
This is the chart in Excel:
Here is the chart in PDF:
Can you please send us your Excel file so that we can investigate the chart?
Also, what version of GemBox.Spreadsheet are you using, have you tried with the current latest version?
I sent the workbook in response to your email since I cannot upload it to the form. I am using version 49.0.0.1017 which should be the latest.
Hi,
GemBox.Spreadsheet currently supports only the automatic chart axis labels rotation, limited to 0, 45, and 90 degrees.
However, note that we do have an internal ticket for adding support for custom rotation (set by ChartAxis.TextBoxFormat.Rotation) to our rendering engine.
We plan to work on this feature and some other chart improvements in the upcoming months.
I hope this helps.