Hi,
I am adding data to an excelChart and then outputting it to a presentation slide.
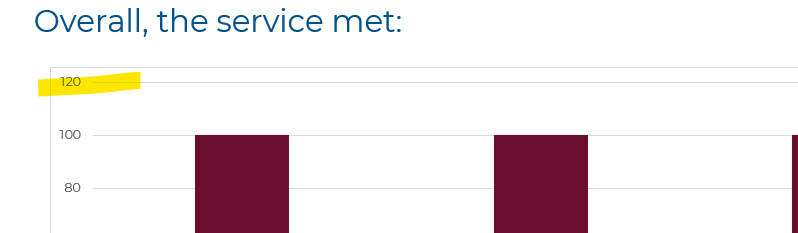
The max values they can be are “100” but the chart is pushing the Y-axis to 120. Is there a way to set the axis maximum?
With Microsoft charting, you would do something like
chart.ChartAreas["ChartArea1"].YAxis.Maximum = 100;
But I can’t seem to find the relevant code path to set that in Gembox.