Hi,
I have created a project where I am created a pie chart , bar chart and line chart based on the data being sent, now the values of the chart are amounts like thousands and millions, when i hover over any part of say pie chart it is just showing the number no formatting or currency. I have implemented the formatting part where we add currency symbol and decimal, but still it will show same plane number. When i click on chart and right click to edit chart data and save again than it will work. But thats not what i want.
Can you please help
Hi! This sounds like your number formatting is not linked so you can try setting ChartAxis.NumberFormatLinkedToSource to ‘true’.
Hi thanks for the response please take a look at my code, I am not clear with where i need to use this solution you provided
       List<ExportChartData> chartTable;

        var slide = firstLastSlidesPresentation.Slides.AddNew(SlideLayoutType.Blank);

        Chart chart;

        if (chartType == "pie")
        {
            chartTable = chartTableFull.Take(12).ToList();
            chart = slide.Content.AddChart(GemBox.Presentation.ChartType.Pie,
                 9.5, 1, 320, 185, GemBox.Presentation.LengthUnit.Millimeter);
        }
        else if (chartType == "bar")
        {
            chartTable = chartTableFull.Take(10).ToList();
            chart = slide.Content.AddChart(GemBox.Presentation.ChartType.Bar,
                 9.5, 1, 320, 185, GemBox.Presentation.LengthUnit.Millimeter);
        }
        else
        {
            chartTable = chartTableFull.Take(10).ToList();
            chart = slide.Content.AddChart(GemBox.Presentation.ChartType.Line,
                 9.5, 1, 320, 185, GemBox.Presentation.LengthUnit.Millimeter);
        }


        //Get underlying Excel chart.
        spreedsheetCharts.ExcelChart excelChart = (spreedsheetCharts.ExcelChart)chart.ExcelChart;
        excelChart.Title.Text = chartTitle;
        ExcelWorksheet worksheet = excelChart.Worksheet;
        worksheet.Columns[1].SetWidth(200, GemBox.Spreadsheet.LengthUnit.Pixel);
        var cellCount = 1;
        foreach (var subTable in chartTable)
        {
            worksheet.Cells["A" + (cellCount + 1).ToString()].Value = subTable.crosscutCategory;
            worksheet.Cells["B" + (cellCount + 1).ToString()].Value = subTable.kpiDataChart;
            if(subTable.kpiDataChart < 1000000)
                worksheet.Cells["B" + (cellCount + 1).ToString()].Style.NumberFormat = "$#,##0,,, \"B\"";
            else if(subTable.kpiDataChart < 1000000000)
                worksheet.Cells["B" + (cellCount + 1).ToString()].Style.NumberFormat = "$#,##0,, \"M\"";
            cellCount++;
        }

        // Select data.
        excelChart.SelectData(worksheet.Cells.GetSubrange("A1:B" + (cellCount).ToString()), true);


        return firstLastSlidesPresentation;
The best place could be inside those if clauses since there you know the exact chart type. You need that information because you cannot access axes from ExcelChart class. E.g.
...
else if (chartType == "bar")
{
    chartTable = chartTableFull.Take(10).ToList();
    chart = slide.Content.AddChart(GemBox.Presentation.ChartType.Bar,
         9.5, 1, 320, 185, GemBox.Presentation.LengthUnit.Millimeter);
    ((GemBox.Spreadsheet.Charts.BarChart)chart.ExcelChart).Axes.Horizontal.NumberFormatLinkedToSource = true;
}
...
If this doesn’t work, send us a small VS project that reproduces this issue.
1 Like
Thanks marko it was of great help
Hi Marko, I used this solution but its still same, the data is getting added right but its not showing right on the chart label, showing 0M and when i click on Edit data it will suddenly show correct data in required format.
Please send us a small Visual Studio project that reproduces your issue so that we can investigate it.
Also, send us another PowerPoint file with a chart which you can create manually (using Microsoft Office) that will show exactly what you want to achieve.
                    using System;
                    using System.Collections.Generic;
                    using System.Linq;
                    using System.Text;
                    using System.Threading.Tasks;
                    using GemBox.Presentation;
                    using GemBox.Spreadsheet;
                    using Operations = GemBox.Presentation;
                    using spreedsheetCharts = GemBox.Spreadsheet.Charts;
                    using System.IO;
                    using GemBox.Presentation.Tables;

                    namespace GemBoxTrialProject
                    {
                        class Program
                        {
                            static void Main(string[] args)
                            {
                                ComponentInfo.SetLicense("FREE-LIMITED-KEY");

                                SpreadsheetInfo.SetLicense("FREE-LIMITED-KEY");

                                Dictionary<string, double> data = new Dictionary<string, double>
                                {
                                    { "Data1", 1398735.888 },
                                    { "Data2", 446985.3341 },
                                    { "Data3", 392459.4284 },
                                    { "Data4", 327113.3642 },
                                    { "Data5", 313341.4554 },
                                    { "Data6", 210292.0576 },
                                    { "Data7", 191433.6671 },
                                    { "Data8", 113204.2774 },
                                    { "Data9", 94020.6119 },
                                    { "Data10", 93679.69118 }
                                };

                                PresentationDocument firstLastSlidesPresentation = new PresentationDocument();
                                var slide = firstLastSlidesPresentation.Slides.InsertNew(0, SlideLayoutType.Blank);

                                var chart = slide.Content.AddChart(GemBox.Presentation.ChartType.Bar,
                                        9.5, 1, 320, 185, GemBox.Presentation.LengthUnit.Millimeter);

                                ((GemBox.Spreadsheet.Charts.BarChart)chart.ExcelChart).Axes.Horizontal.NumberFormatLinkedToSource = true;

                                //Get underlying Excel chart.
                                spreedsheetCharts.ExcelChart excelChart = (spreedsheetCharts.ExcelChart)chart.ExcelChart;

                                excelChart.Title.Text = "Chart Title";

                                ExcelWorksheet worksheet = excelChart.Worksheet;
                                worksheet.Columns[1].SetWidth(200, GemBox.Spreadsheet.LengthUnit.Pixel);
                                var cellCount = 1;
                                foreach (var subTable in data)
                                {
                                    worksheet.Cells["A" + (cellCount + 1).ToString()].Value = subTable.Key;
                                    worksheet.Cells["B" + (cellCount + 1).ToString()].Value = subTable.Value;

                                    if (subTable.Value <= 999999)
                                        worksheet.Cells["B" + (cellCount + 1).ToString()].Style.NumberFormat = "$#0,\"K\"";
                                    else if (subTable.Value <= 9999999)
                                        worksheet.Cells["B" + (cellCount + 1).ToString()].Style.NumberFormat = "#,##0,, \"M\"";
                                    cellCount++;

                                }

                                // Select data.
                                excelChart.SelectData(worksheet.Cells.GetSubrange("A1:B" + (cellCount).ToString()), true);

                                excelChart.DataLabels.Show();

                                firstLastSlidesPresentation.Save("sample.pptx");


                            }
                        }
                    }
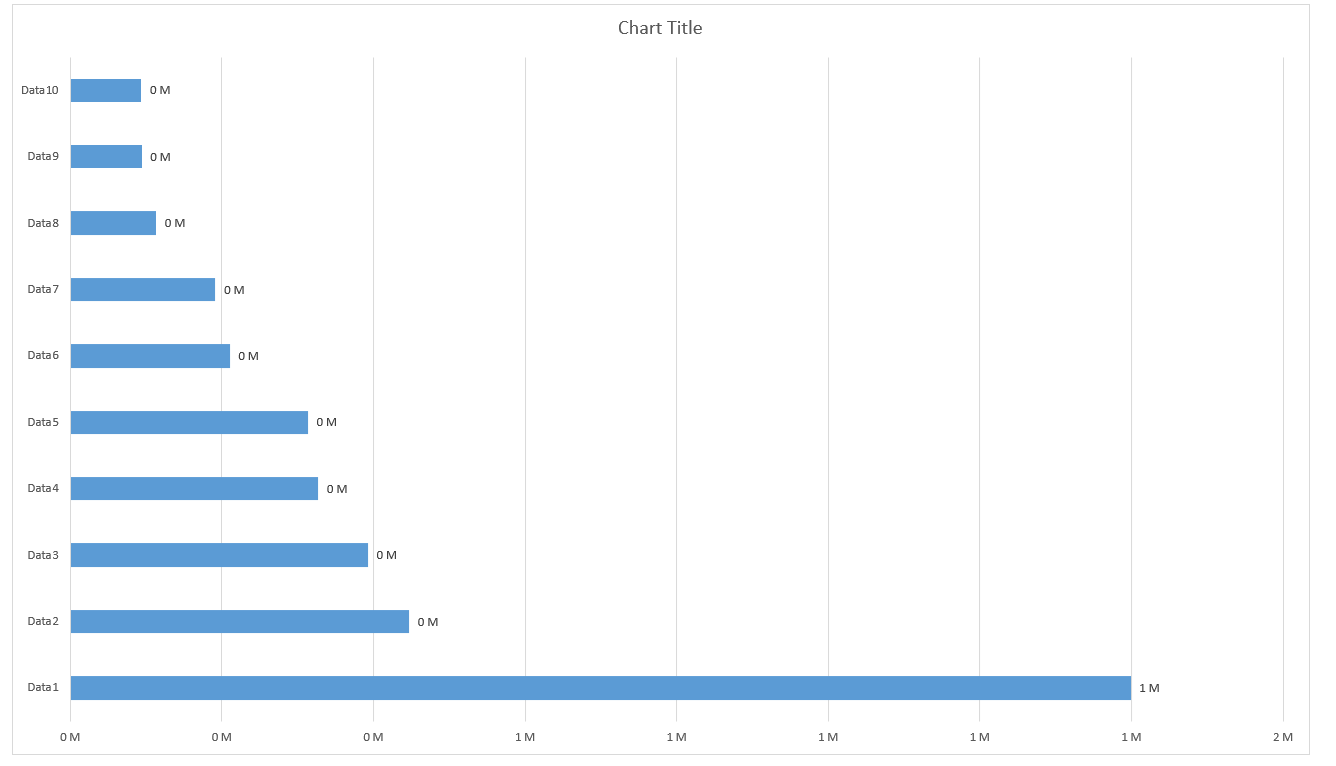
This is the code you can run this code and you will get a file with following out put image1
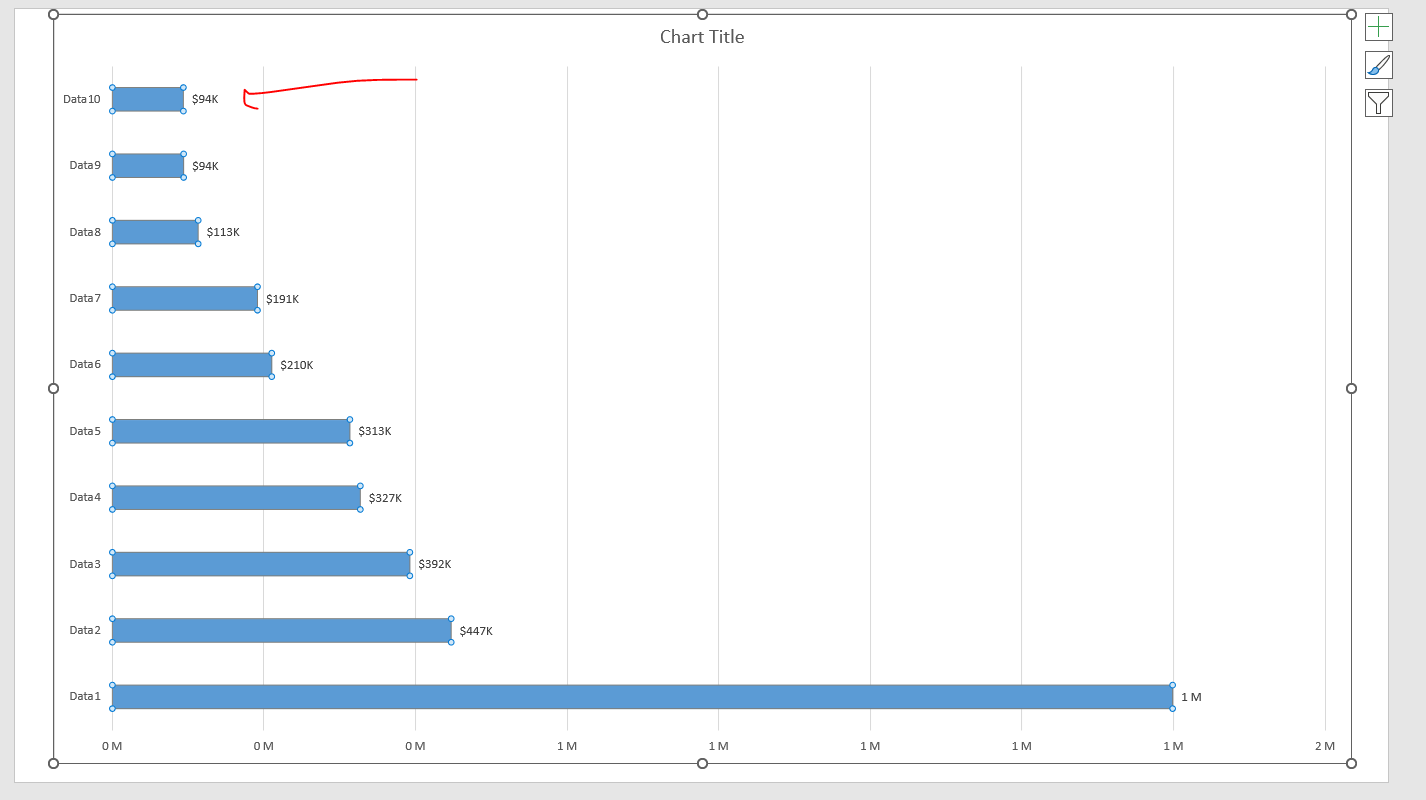
when you right click and select edit data suddenly the chart data will change to following data
please help me out on this issue 
did you get any solution for the issue?
Hi,
Please try again with these latest NuGet packages:
Install-Package GemBox.Presentation -Version 27.0.1041-hotfix
Install-Package GemBox.Bundle -Version 49.0.1747-hotfix
Does this solve your issue?
Regards,
Mario
I have installed the GemBox package and for bundler the stable is 51.0.1056 , for the version you mentioned i am getting error
- Install-Package : Package ‘GemBox.Bundle 49.0.1747-hotfix’ is not found in the following primary
- source(s): 'https://api.nuget.org/v3/index.json,C:\Program Files (x86)\Microsoft
- SDKs\NuGetPackages'. Please verify all your online package sources are
- available (OR) package id, version are specified correctly.
- At line:1 char:1
- Install-Package GemBox.Bundle -Version 49.0.1747-hotfix
-
- CategoryInfo : NotSpecified: ( [Install-Package], Exception
- FullyQualifiedErrorId : + + NuGetCmdletUnhandledException,NuGet.PackageManagement.PowerShellCmdlets.InstallPackageCommand
and I have latest bundle available and i have added the hotfix package for gembox presentation but still the issue is not solved
Try it again, the NuGet server sometimes requires a few minutes to validate the new packages.
Also just as an FYI, if you’re using GemBox.Bundle then instead of those individual packages, please try installing this latest GemBox.Bundle package (it contains the latest GemBox.Spreadsheet and GemBox.Presentation versions):
Install-Package GemBox.Bundle -Version 51.0.1071-hotfix
Does this solve your issue?
1 Like
Yes its working great thanks for the update. Can I go with same hotfix for production deployment or are you going to put a stable release for this fix?
You can feel free to use the pre-released versions, our pre-released versions go through the same testing process as our publicly released versions.
Please note that we do not make public releases on each build, instead, we do it after a few fixes and/or enhancements (cumulative updates), on a monthly basis.