I am using the Gembox Spreadsheet for reading a xlsm file, correct and calculate some stuff and then save it to pdf.
Today I came across this problem in one of our template files.
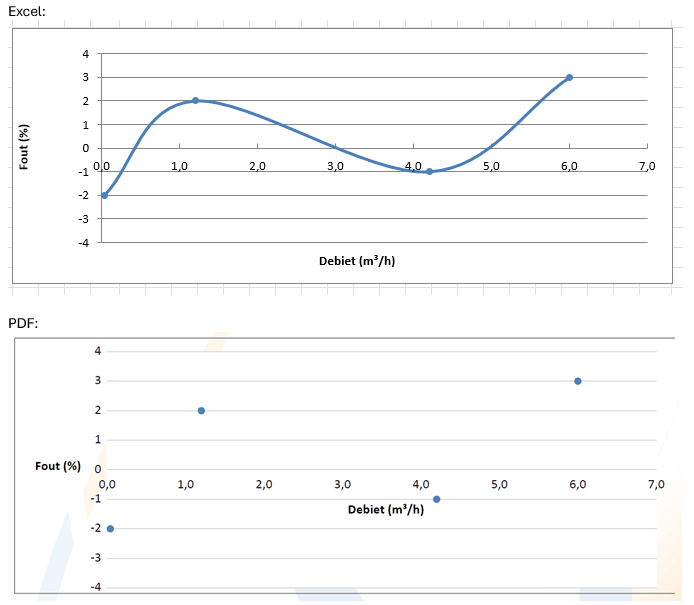
The scatter chart in Excel is correctly drawm as you can see in the example.
After saving to pdf the chart is different, axis are not how they should be but most important, the chart line is missing as you can see in example2.
I upgraded to the latest version (49.0.1379) but that didn’t help.
Do I need to do something in code to fix this or is it a bug ?