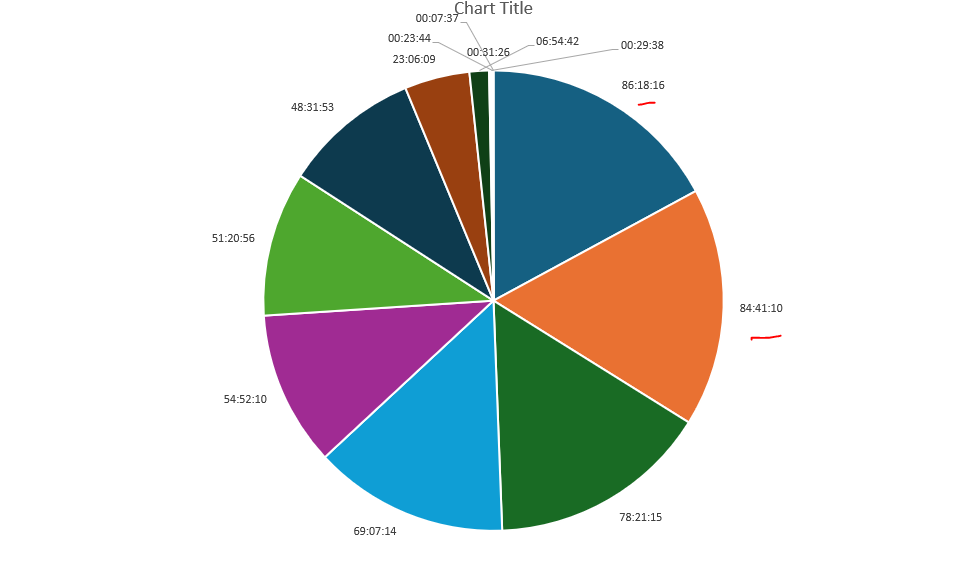
Hi I am trying to add time duration data in pie chart and show the labels.
“86:18:16”,
“84:41:10”,
“78:21:15”,
“69:07:14”,
“54:52:10”,
“51:20:56”,
“48:31:53”,
this is a sample type. Its not working. can you provide any suggestions ?
Hi I am trying to add time duration data in pie chart and show the labels.
“86:18:16”,
“84:41:10”,
“78:21:15”,
“69:07:14”,
“54:52:10”,
“51:20:56”,
“48:31:53”,
this is a sample type. Its not working. can you provide any suggestions ?
You mentioned it’s not working, can you show me what you’re currently doing?
Please create a small Visual Studio project that demonstrates how you’re setting those time values.
here is a sample code
   static void Main(string[] args)
    {
        ComponentInfo.SetLicense("FREE-LIMITED-KEY");

        SpreadsheetInfo.SetLicense("FREE-LIMITED-KEY");

        Dictionary<string, string> data = new Dictionary<string, string>
        {
            { "data1", "86:18:16" },
            { "data2", "84:41:10" },
            { "data3", "78:21:15" },
            { "data4", "69:07:14" },
            { "data5", "54:52:10" },
            { "data6", "51:20:56" },
            { "data7", "48:31:53" },
            { "data8", "23:06:09" },
            { "data9", "6:54:42" },
            { "data10", "0:31:26" },
            { "data11", "0:29:38" },
            { "data12", "0:23:44" },
            { "data13", "0:07:37" }
        };

        PresentationDocument firstLastSlidesPresentation = new PresentationDocument();
        var slide = firstLastSlidesPresentation.Slides.InsertNew(0, SlideLayoutType.Blank);

        var chart = slide.Content.AddChart(GemBox.Presentation.ChartType.Pie,
                9.5, 1, 320, 185, GemBox.Presentation.LengthUnit.Millimeter);

        //Get underlying Excel chart.
        spreedsheetCharts.ExcelChart excelChart = (spreedsheetCharts.ExcelChart)chart.ExcelChart;

        excelChart.Title.Text = "Chart Title";
        excelChart.DataLabels.Show();


        ExcelWorksheet worksheet = excelChart.Worksheet;
        worksheet.Columns[1].SetWidth(200, GemBox.Spreadsheet.LengthUnit.Pixel);
        var cellCount = 1;
        foreach (var subTable in data)
        {
            worksheet.Cells["A" + (cellCount + 1).ToString()].Value = subTable.Key;
            worksheet.Cells["B" + (cellCount + 1).ToString()].Value = subTable.Value; //how to add this data here

            worksheet.Cells["B" + (cellCount + 1).ToString()].Style.NumberFormat = "#0" ;//how to do the formatting to see the data as it is in the dictonary

            cellCount++;
        }

        // Select data.
        excelChart.SelectData(worksheet.Cells.GetSubrange("A1:B" + (cellCount).ToString()), true);


        firstLastSlidesPresentation.Save("sample.pptx");
       }
What is want is , the data is in duration format and i want to show the data like that in lables and also create the chart using that data
Data should be something like in the snapshot i added
hello did yo find any solution?
Try this:
foreach (var subTable in data)
{
    int[] timeParts = subTable.Value.Split(':').Select(int.Parse).ToArray();
    var time = new TimeSpan(timeParts[0], timeParts[1], timeParts[2]);

    worksheet.Cells["A" + (cellCount + 1).ToString()].Value = subTable.Key;
    worksheet.Cells["B" + (cellCount + 1).ToString()].SetValue(time);
    cellCount++;
}
You may notice that I’m using the ExcelCell.SetValue(TimeSpan) method, this is an extension method that you can find on the following SO post:
c# - Set Excel cell to TimeSpan value - Stack Overflow
I hope this helps, let me know if you need anything else.
Regards,
Mario
Hi Mario, It looks like the SetValue function doesn’t take timespan type as input. I tried to convert it to DateTime but its not working.
Again, please check the Stack Overflow post I linked, that specific SetValue is an extension method:
public static class GemBoxHelper
{
    public static void SetValue(this ExcelCell cell, TimeSpan span, string format = "[h]:mm:ss")
    {
        DateTime start = cell.Worksheet.Parent.Use1904DateSystem ?
            new DateTime(1904, 1, 1) :
            new DateTime(1899, 12, 30);

        DateTime date = start.Add(span);
        DateTime leapYearBug = new DateTime(1900, 3, 1);

        if (date < leapYearBug)
            date = date.AddDays(1);

        cell.SetValue(date);
        cell.Style.NumberFormat = format;
    }
}
Yes its working now thank you very much for the help.